The pytest unit-testing framework for Python comes with some powerful debugging abilities via the interactive Python debugger (“Debug Mode”), which utilizes the following two libraries: the included pdb library, and the improved (but optional) ipdb library. This interactive Python debugger lets you take control of scripts in realtime for easy debugging.
Debug Mode in pytest can be triggered in a few different ways:
- Your test raises an exception after passing the
"--pdb"option to"pytest". - The moment your test begins after passing the
"--trace"option to"pytest". - Calling
"pdb.set_trace()"or"ipdb.set_trace()"from your test after importing"pdb"or"ipdb"respectively. (Python versions 3.7+ and newer can also use the"breakpoint()"method to enter Debug Mode.)
When Debug Mode is activated, the browser window will remain open (when used in combination with browser automation), and you can see how variables look from the command-line.
(Note that you may need to add "-s" to your "pytest" run command to allow breakpoints, unless you already have a "pytest.ini" file present with "addops = --capture=no" in it.)
Once you’re in Debug Mode, there are several commands that you can use in order to control and debug tests:
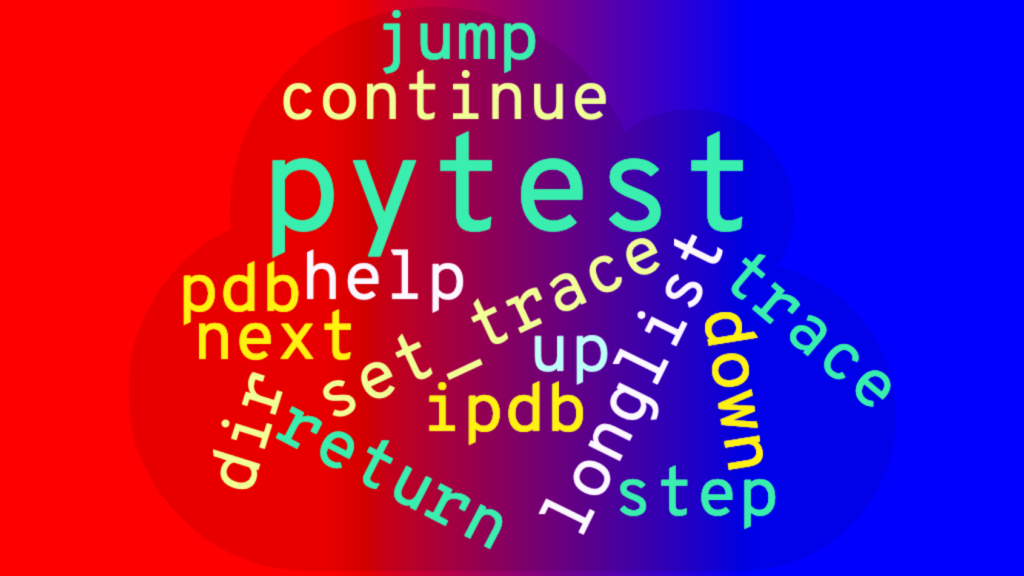
n (next): Execute the next line of the current method block.s (step): Step through and execute the next line of the current method block (but if the current method calls another method, go down the stack).c (continue): Leave Debug Mode and continue the test where the current method left off.r (return): Continue running the test until the current method returns.j (jump): Jump to the line number of the current method block.w (where): Show where you are within the current stack trace.u (up): Move up the stack.d (down): Move down the stack.ll (longlist): See the code for the current method block.dir(): List namespace objects.h (help): List all available commands.
Additionally, you can execute any Python code that you want from within Debug Mode.
Not all Debug Modes are the same. If you enter Debug Mode after a test raises an exception, you are in the special “Post Mortem Debug Mode”, which lets you explore the stack of the current stack trace, but you can no longer advance to the next line of the method that you were in because that would end the test immediately.
The ipdb add-on improves the experience of the pdb debugger:
ipdb Debug Mode adds color-coded syntax highlighting, tab-completion, and an expanded view of the code with line numbers. ipdb must be installed separately from pytest before use:
pip install ipdb
In order to use the ipdb library by default in “Post Mortem Debug Mode”, you need to call your pytest run command with this set of args:
--pdb --pdbcls=IPython.terminal.debugger:TerminalPdb
You can make that effect more permanent by using a pytest.ini file that includes a line with:
addopts = --pdbcls=IPython.terminal.debugger:TerminalPdb
At that point, all you need to add is the --pdb option when you want tests to enter ipdb Debug Mode on failures.
Once you familiarize yourself with the controls of Debug Mode, debugging tests will become much easier, and you’ll save a lot of time with test creation and maintenance!