Meet pdbp (Pdb+) — SeleniumBase‘s new built-in Python debugger!
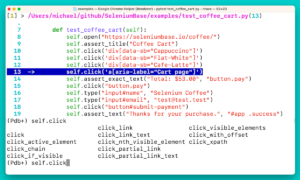
Why not just use Python’s built-in pdb debugger or another existing one like ipdb or pdbpp? Starting with pdb, it has a limited display with no color and limited abilities. Here’s Python’s built-in pdb debugger:
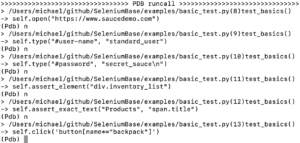
The ipdb debugger added tab completion, syntax highlighting, better tracebacks, etc. (I talked about it in a past blog post.) Here’s a sample of how it looks:
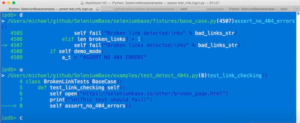
The major drawback is that it comes with a high number of external dependencies that take time to download. Here’s a pipdeptree for ipdb dependencies:
> pipdeptree
ipdb==0.13.13
├── decorator [required: Any, installed: 5.1.1]
└── ipython [required: >=7.31.1, installed: 8.14.0]
    ├── appnope [required: Any, installed: 0.1.3]
    ├── backcall [required: Any, installed: 0.2.0]
    ├── decorator [required: Any, installed: 5.1.1]
    ├── jedi [required: >=0.16, installed: 0.18.2]
    │   └── parso [required: >=0.8.0,<0.9.0, installed: 0.8.3] ├── matplotlib-inline [required: Any, installed: 0.1.6] │ └── traitlets [required: Any, installed: 5.9.0] ├── pexpect [required: >4.3, installed: 4.8.0]
    │   └── ptyprocess [required: >=0.5, installed: 0.7.0]
    ├── pickleshare [required: Any, installed: 0.7.5]
    ├── prompt-toolkit [required: >=3.0.30,<3.1.0,!=3.0.37, installed: 3.0.38] │ └── wcwidth [required: Any, installed: 0.2.6] ├── Pygments [required: >=2.4.0, installed: 2.15.1]
    ├── stack-data [required: Any, installed: 0.6.2]
    │   ├── asttokens [required: >=2.1.0, installed: 2.2.1]
    │   │   └── six [required: Any, installed: 1.16.0]
    │   ├── executing [required: >=1.2.0, installed: 1.2.0]
    │   └── pure-eval [required: Any, installed: 0.2.2]
    └── traitlets [required: >=5, installed: 5.9.0]
If you’re already using ipython, this isn’t a problem because you’ll already need to download most of these dependencies anyway. But if you’re not using ipython… you’ll still need to download those dependencies.
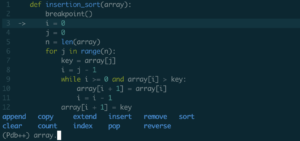
Up next, is the pdbpp debugger. It has tab completion, syntax highlighting, better exceptions, different modes for displaying code so that you can get a full view vs. line-by-line, etc. Here’s a sample of how it looks:
Here’s what the main issue is: pdbpp has a dependency on fancycompleter, which has a Windows dependency on pyreadline (https://github.com/pyreadline/pyreadline), which has this issue: pyreadline/pyreadline#65, which leads to this error: AttributeError: module 'collections' has no attribute 'Callable'. This is a major problem for Windows users running Python 3.11 or newer.
Here’s what I did to fix and improve on that: (Using pdbp)
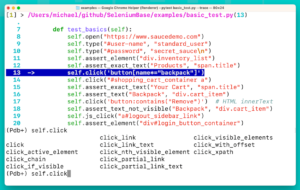
I created the pdbp (Pdb+) Python debugger with a dependency on my own library tabcompleter (https://github.com/mdmintz/tabcompleter), which has a dependency on the improved pyreadline3 (https://github.com/pyreadline3/pyreadline3/) instead of pyreadline. Then things started working again. As a bonus, I fixed some bugs, improved on default configuration settings, and added some new features.
Not only is it powerful, but it’s also light on dependencies. Here’s a pipdeptree for pdbp:
> pipdeptree
pdbp==1.5.0
├── Pygments [required: >=2.16.1, installed: 2.17.2]
└── tabcompleter [required: >=1.3.0, installed: 1.3.0]
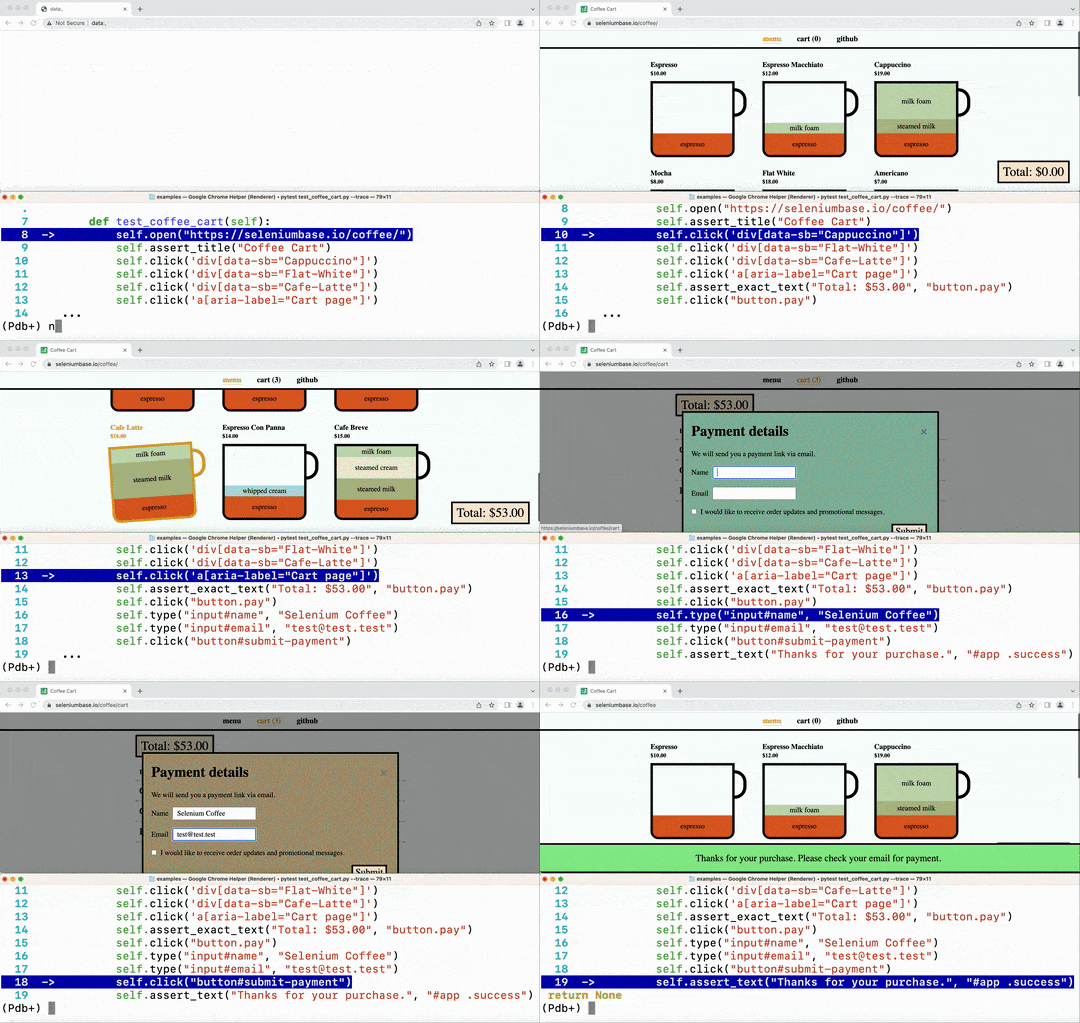
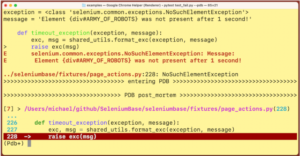
Here are a few examples of the new pdbp debugger in action:
Now that we’ve covered the differences between debuggers, let’s cover installation:
pip install pdbp (Note: pdbp is already included with seleniumbase)
Then add import pdbp to an __init__.py of your project, which will automatically make Pdb+ the default debugger at breakpoints.
Now let’s talk about using it:
Debug Mode in pytest can be triggered in a few different ways:
- Your test raises an exception after passing the
"--pdb"option to"pytest". - The moment your test begins after passing the
"--trace"option to"pytest". - Calling
"pdb.set_trace()"or"pdbp.set_trace()"from your test after importing"pdb"or"pdbp"respectively. (Calling the"breakpoint()"method also works.) - At the end of a SeleniumBase test if you added the
"--final-debug"or"--ftrace"options to"pytest".
When Debug Mode is activated, the browser window will remain open (when used in combination with browser automation), and you can see how variables look from the command-line.
(Note that you may need to add "-s" to your "pytest" run command to allow breakpoints, unless you already have a "pytest.ini" file present with "addops = --capture=no" in it.)
Once you’re in Debug Mode, there are several commands that you can use in order to control and debug tests:
n (next): Execute the next line of the current method block.s (step): Step through and execute the next line of the current method block (but if the current method calls another method, go down the stack).c (continue): Leave Debug Mode and continue the test where the current method left off.r (return): Continue running the test until the current method returns.j (jump): Jump to the line number of the current method block.w (where): Show where you are within the current stack trace.u (up): Move up the stack.d (down): Move down the stack.ll (longlist): See the code for the current method block.dir(): List namespace objects.h (help): List all available commands.
Here are some new commands added by pdbp:
sticky: Toggle between sticky and non-sticky mode, which shows full code blocks vs individual lines in a stack.trun (truncate): Use this to toggle between truncating or not truncating long lines in sticky mode.
Additionally, you can execute any Python code that you want from within Debug Mode.
Now that you’ve covered the basics on using pdbp, see the pdbp GitHub ReadMe for more details, and see the SeleniumBase GitHub page for all your browser automation needs!
